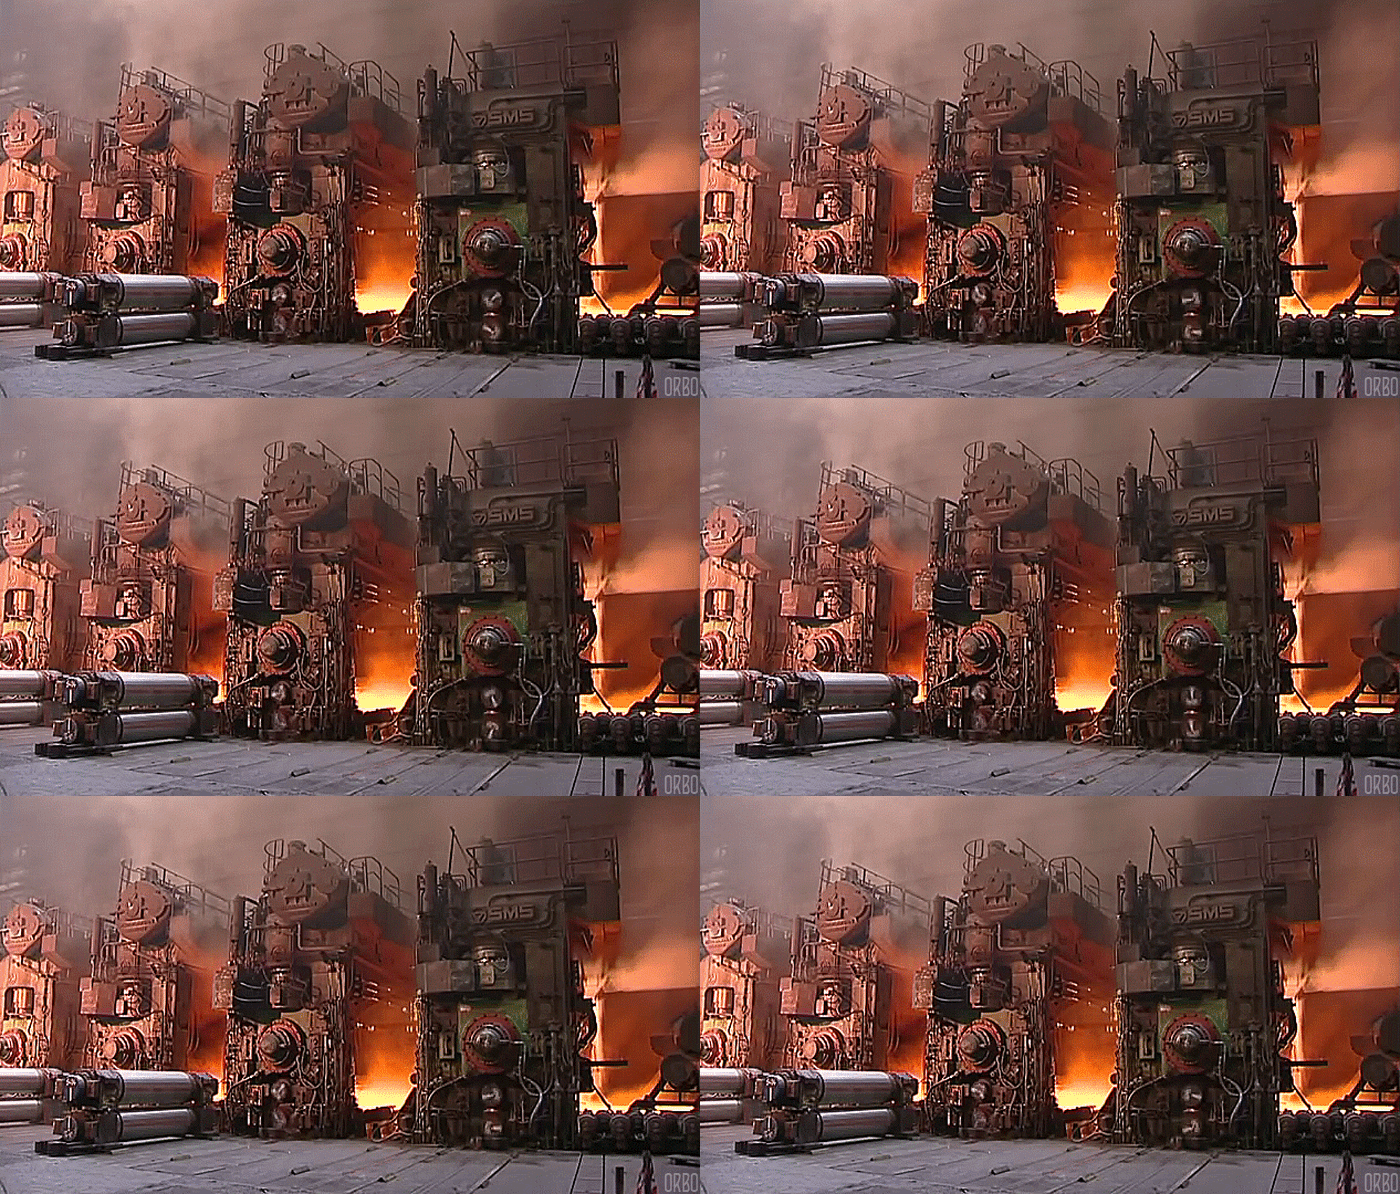
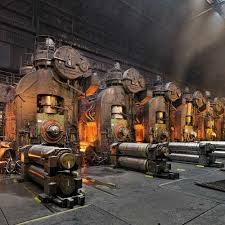
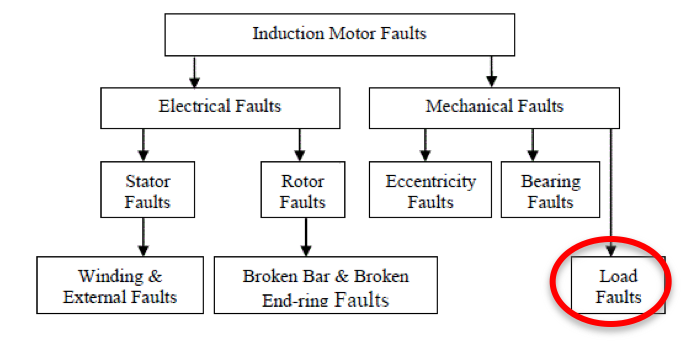
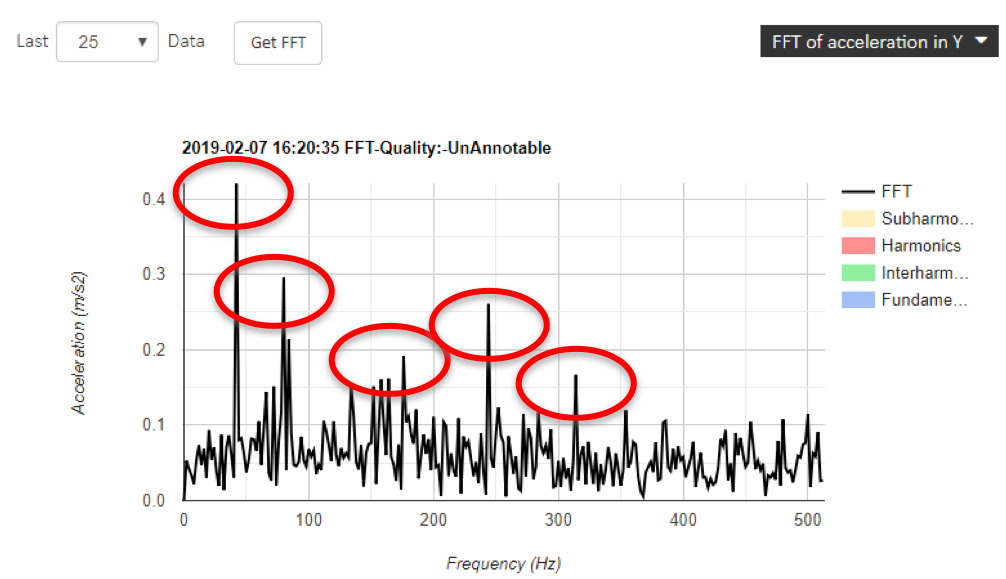
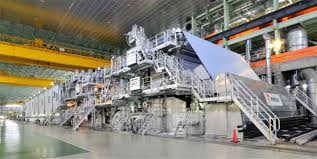
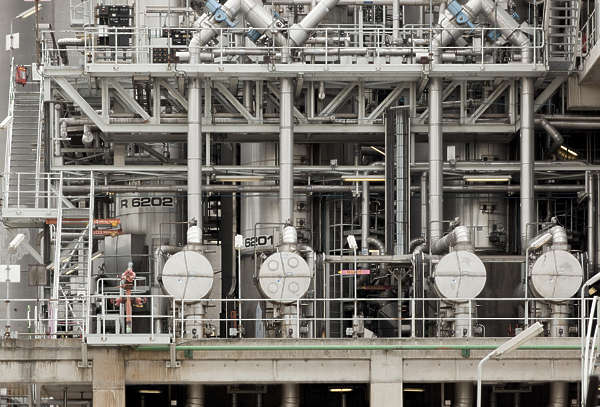
 The 1970s were a period of major steel plant expansions and plant scale increased dramatically. Plant train size and capacity became increasingly dependent on very few, large, expensive machines. The loss of one of these major assets greatly affected the reliability and performance of these steel mills, and resulted in several income losses. This resulted in the development of fault-protection systems for protecting capital machinery from a major catastrophic occurrence. Due to the success of these systems, many plant operators begin to suspect that similar approaches could be used for smaller plants. However, the high per-machine cost of applying a fault protection system prohibited this from becoming a reality. Technology fixed this with the production of portable measurement instruments. In the late 1980s, the expansion of the computer and internet technology guided the development of mobile data acquisition systems, which were an immediate success in the plant maintenance market. The mobile acquisition systems spread to many industries, including the steel industry. Throughout brilliant progressions in technology, these systems have reached a point where the limit is no longer constrained by measurement technology. The main issue in steel mills is that collecting, analyzing and logging data for monitoring is a huge endeavor, it takes a lot of valuable time and effort in order to successfully gather the data. In a typical mini-mill environment, the actual execution and responsibility for such a walk-around vibration program resides either in-house or with outside contract resources. A typical large mill could have around 800 to 1000 machines under surveillance. This represents, under typical conditions, about one to 3-4 man-weeks of measurement effort alone. In a data collection program, achieving a whopping 65 to 80 percent of load factor is a significant achievement. But still using traditional monitoring systems that are hard wired in to the steel mill machinery involves reviewing load of data and this makes the problem of finding errors like finding a needle in a haystack. This eats up a lot of the time of onsite maintenance personnel who are tied to the mill and leverage preventive maintenance schedules to ensure that they have control of the equipment powering these steel mills. Today’s data acquisition systems are wifi or X-G enabled, are extremely powerful and represent tremendous growth over the past few years. Edge processing in these devices have helped ensure better bandwidth utilization and improve computational efficiencies. These advances in technology and the Internet have also driven the development of remote monitoring systems. Today, technology and the Internet has enabled us to access information anywhere, anytime. This current method requires us to use advanced software and access to plant and external networks for data transmission. Data acquisition and monitoring is only one part of the puzzle, the bigger problem is how to make sense of the data. Data analysis is expensive, it is hard, driving to insights is typically in the hands of 1-2 subject matter vibrations or maintenance experts at the plant. So despite very capable acquisition systems, the success of such condition monitoring systems relies on the successful interpretation of such acquired data. When steel plants transitioned in the 90’s from the practice of hard wired monitoring to a remote monitoring environment, one of the observations was that the vibration levels that were captured from the steel mill induction motors and machinery were varying much more than had been apparent from the monthly manual data. It was also clear that the variations had a pattern that closely tracked ambient temperatures. Since bearing temperatures also were being monitored, it was clear that when ambient temperature went up, vibration levels increased dramatically. Condition Monitoring has the ability to monitor parameters other than what would normally be monitored in a traditional manual program. One of the most significant benefits is that it offers more frequent monitoring of machinery without a need for data collection/analysis personnel to be present, as well as the ability to observe dynamic changes in machine condition due to load, speed and operating conditions. The steel industry has been more than willing to adapt to the method of condition monitoring, as a way to improve mill productivity and show growth overall. Today’s model for condition monitoring at a steel mill allows one to monitor induction motors and other machinery in real time using wifi enabled sensors anytime and from any place. This is enabled by a cloud based system that collects the sensor data from the steel mill and then uses machine learning algorithms to sieve through the data. The algorithm also then sends alarms when it finds abnormal conditions in the data that predict some form of early failure. The sensors are easy to install, they literally take minutes to install, stick magnetically to the machinery and can be powered by a AC outlet. This allows a plant to be digitized rapidly and by non technical personnel thereby reducing the cost of deployment. Deployment and support can also be done in a remote model by the team. Ennosys’ sensors and monitoring solutions are used to monitor rotating equipment at a major steel mill in North America. The sensors were deployed on the mill SCIM motors, mill air compressors and emergency generator sets. Mill personnel have full access to data, alert histories, alarms and warnings, reports and report/machine histories. Alerts are transmitted by e-mail and/or cell phone SMS text message. Upon installation, much higher vibration levels were noted by the offsite remote monitoring analyst. Steel Mill personnel, who were responsible for the induction motors, were notified of the increased vibration. The key was not just to look at the vibration increase but review the frequency harmonic patterns. The machine learning algorithms automatically reviewed the patterns of the frequency harmonics that which showed that the fundamental frequency peak at 40 - 42 Hz, followed by harmonic order 2nd, 4th, 6th, 8th at 80, 176, 244, 344 Hz. The algorithm then use the pattern database and the algorithm to indicate possible bearing looseness due to a improper loading condition.This was a self diagnostic procedure that was completed by the machine learning algorithm; which then sent an alarm (email/SMS) to the maintenance person. The value of the solution is the minimal monitoring support that is needed both by the onsite Steel Mill personnel or even our internal monitoring team. Reach out to us to learn more about how we can help your steel mill with its condition monitoring efforts. Author: AakritiAakriti is a Business and Marketing Consultant with Ennosys  Paper mills are looking for methods to reduce operating costs, minimize maintenance activities, while optimizing plant availability and uptime. The key to this process are techniques such as predictive and preventative maintenance using vibration monitoring as a key indicator of machine health. Vibration monitoring and analysis of paper mill processes have been in vogue for number of years. If a roll bearing fails when a paper machine is operating at high speed, extensive machine damage and the loss of substantial amounts of paper can result. In addition, production stops until repairs are made and the machine is restarted. In the past, mills relied on periodic “walk-arounds” by technicians using portable data collectors to measure vibration levels at various points. However, if a bearing failed between data collection rounds (and a serious fault can develop in as little as eight hours), the result could be very costly. Also, mill safety supervisors favored finding a means of remote monitoring of vibration data so that data collection technicians would not have to go near the operating machines This was the advent of vibration monitoring and equipment that once installed can be hard wired in to a control SCADA and HMI system or database to visualize the vibration (time series and frequency data). Plant maintenance technicians could then review this maintenance data and then analyze the vibration data to be able to identify potential failures. One of the major challenges in this model was the amount of data that was collected, and the effort needed to find the “needle in the haystack”. The analysis and diagnostic procedure was very manual, and this involved a significant investment of time by the maintenance and engineering teams in being able to identify failure. A fault in one of the rollers in a paper mill would result in a disruptive failure resulting in a complete shutdown of the mill. The other issue with such a hard-wired monitoring system was the sheer installation cost and the technical challenges involved in the installation. One example of this was at a paper mill – that produced 300K Tm/year of Kraft paper; they followed the Kraft process for paper manufacturing, which involved the following elements: Impregnation, Cooking, Recovery, Blowing, Screening, Washing and Bleaching. This was then followed by the “Press Area” and the “Dry Area”. The following shows a schematic of a typical paper mill The paper machine worked with a velocity of 750 m/min and with a weight of paper between 115 and 300 g/m; electric drives were AC with a variable speed, frequency variator. The plant had been using vibration monitoring as a fundamental tool for equipment monitoring for more than 12 years. Most of the initial installation relied on analog devices and equipment that was installed in the 90’s, but in 2008, they decided to revamp their monitoring systems using a digital interface. The initial installations were on the press areas and drying areas as shown in the diagram below  The press area of the paper machine has the harshest environment for the monitoring system due to the water pressure used for cleaning and the presence of chemical products like caustic soda and ClH in dissolution. The dryer area is a relatively safer place for the sensors but there are a number of sensors that need installation. Due to the sheer number of rollers that could breakdown in a commercial paper mill, there was a need for almost 600 – 700 sensors in these areas alone for one paper assembly line. A possible breakdown could include a bearing failure of anyone of the rollers and this would result in total unavailability of plant, downtime, lost production and significant economic impact. But the initial installations were hard wired, laborious and took a lot of time – the installation took almost 21 days and involved a complete shut down by the plant for safety reasons. Conduit pipes and Cables had to be installed, right pipes for the cables and right layout of conduit needed to be installed to avoid difficulties in the normal operations of cleaning of the machine, or replacement of the floor cloths. About 20-30 boxes of sensor unions were then installed from which multiple cables were drawn to the final destination; namely the electrical boxes. Then the electrical boxes and associated wiring were installed for the entire plant. Additionally, the installation needed 5 monitors, with a total of 80 channels of measurement per box, a local system and database to store and visualize the data. Today, advances in cloud, wireless and data analytics have enabled such installations to be completed in less than half the time. A sensor mesh in a plant allows Wifi enabled “Smart Sensors” to connect instantaneously. Installations today do not tap in to any hard-wired controllers, network boxes or cable boxes, the sensors connect directly to a gateway or router and then broadcast sensor data to the cloud. The additional advantage is that the data can be securely saved and visualized anywhere, you are not bound to the terminal in the paper plant. The mill’s chief vibration analyst can log onto the system from home, so he is on alert 24/7. If there’s an alarm, he can immediately access historical data on that point and analyze the vibration, looking at the trend lines to see exactly what happened and when. All the information needed to predict if and when a roller or bearing will fail is available, so maintenance supervisors can determine when to take action to avoid an unwanted machine shutdown. Our experience in such installations suggests that it is still important to consider the following factors
One of the very first monitoring points in a paper mill, revealed serious paper roll vibration, which was diagnosed as an improperly installed roller bearing. That catch prevented machine downtime and saved the mill nearly $40,000. Talk to us about how Ennosys can help you digitize and transform your enterprise monitoring model for your paper mill! Most motors are designed to operate for about 20 years, with proper maintenance, so longevity should not be a problem. However, a large number of motors are not reaching their expected life. At a client, a 2 hp motor, for example, running a conveyor section at a major food producer’s facility suddenly failed, shutting down the line. Water had seeped into the conduit box during washdowns and eventually ate away at the cabling insulation. It cost the company hundreds of thousands of dollars in lost product and production time. Why did this get missed?
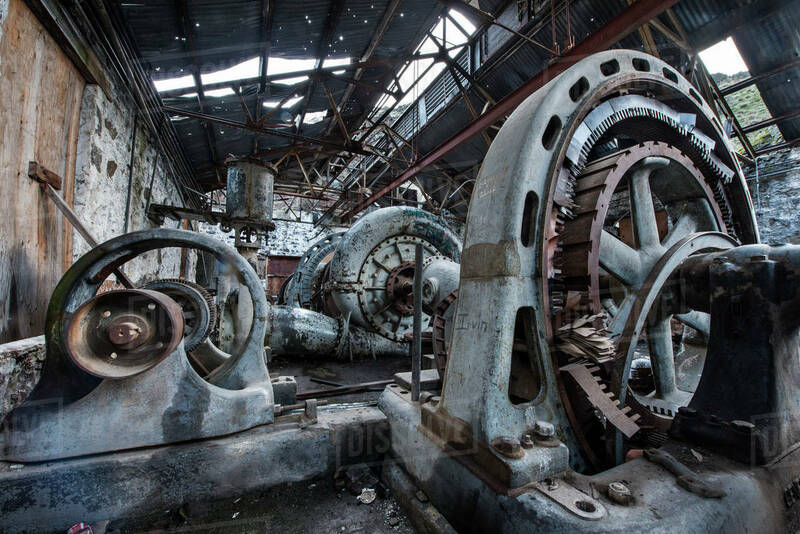
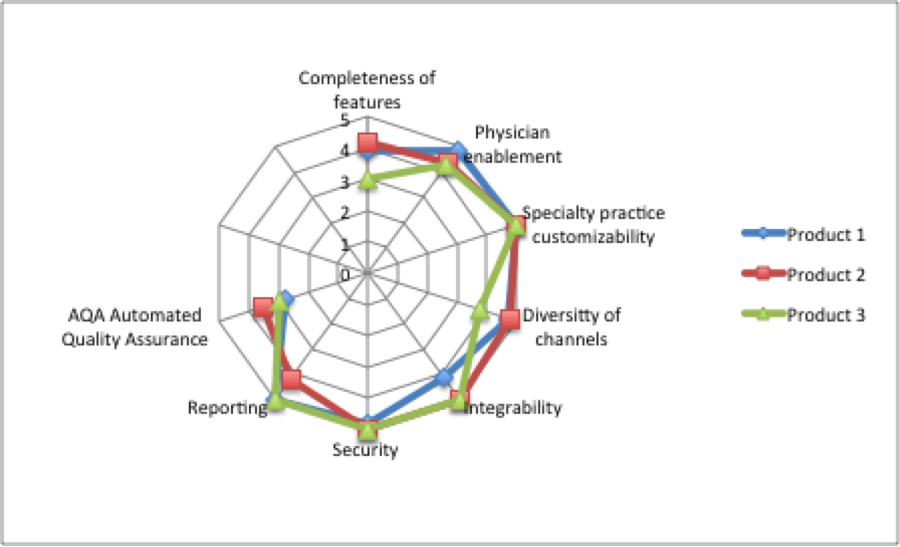
One reason was that due to the expense of monitoring equipment, the company had not invested in any predictive monitoring, they had regular preventive maintenance schedules and somehow their existing maintenance schedules had missed the fact that the water had seeped in. Another reason was that there was insufficient knowledge about application effects on motor operation within the maintenance team. Research indicates that 86% of companies using motors, said their motors rarely lasted longer than 5 to 10 years. No one indicated that they had a motor survive to its 15th year. In fact, most were experiencing significant motor failures in the second or third year of a motor’s life, getting about 25% or less of the life designed into a standard motor. The top reasons for such disruptive failure were Bearing failure, motor abuse, grease contamination followed by improper motor installation, most of which could be diagnosed by predictive maintenance review of data. The Ennosys IOT EYE: A Predictive Monitoring Service enables organizations to improve the effectiveness of their maintenance in a non-disruptive manner. Learn how we can view the operating characteristics of a machine in minutes online. The sensors magnetically mount on industrial machinery and broadcast the machine data to the cloud. Our FFT and AI based algorithms then work on the data to diagnose “machine faults” with a high degree of accuracy. Learn how the Ennosys EYE could transform your maintenance operation here Hospitals and healthcare organizations must be able to catalog and appropriately charge for all services that they provide to their patients. Each patient is a customer and it is important that the hospital is able to correctly catalog the disease and then charge the appropriate amount for each such service. In our healthcare system, this is further complicated by the diversity of coding arcana (ICD, CPT etc), government regulations and special cases. Physicians lose revenue every day by failing to capture the charges for all the work that they do. Most physicians either do not log all their work, or are delayed in being able to capture and log all the work and services rendered. Physicians expend time and effort after hours and such charge capture is manual, error prone and eats in to their productivity during the day. Most hospital and medical establishments have a CDM (Charge Master) which is part of their EMR / EHR (electronic health or medical records system) which contains a description of their services, and the appropriate amounts to charge for each such service. But the process of collecting these charges is sometimes fraught with issues. The doctors who meet the patients, diagnose their problems and capture these issues in a “patient encounter” may have a very different interpretation of the problem from what is in the CDM. In most hospitals until the advent of the EMR system, this was a manual process and the doctor had to look up a piece of paper, log the service code on a piece of paper which would then be input to the EMR system by a separate clinical and entry group. Lost revenue from improper or late billing affected the bottom line in every hospital. Mobile Charge Capture attempts to address this issue; mobile real time charge capture software allows doctors to capture services rendered, accurately classify these against the right charge codes and then submit these charges in real time to the billing staff who can then process these charges and submit them for reimbursement. Most doctors have a mobile phone and the MCC (Mobile Charge Capture) application allows them to use their phone or a hospital provided mobile device to capture, validate and submit these charges in real time. Errors are reduced significantly and these applications can be directly integrated in to a hospitals EMR system that allows the sync to happen in near real time. Such MCC (Mobile Charge Capture) provides physicians and healthcare organizations compelling return on investment value by reducing lost charges, increasing revenue and expediting the billing process and payment. It has also been shown to reduce denials of billing due to better accuracy of capture and real time validation. Administrative costs also reduce significantly as most of the process gets automated in real time. Billers don’t have to chase after the physicians and patients to validate charges and codes and this significantly speeds up the processing and collection of revenue. Physicians in today’s healthcare organization also face pressures to maximize their RVU productivity. They get paid based on their RVUs and the mobile charge capture software allows physicians to maximize their RVU and by association their bonus payouts. So there is added incentive for not only the healthcare organization but also the physician’s community to adopt this software. Our research analyzed key vendors in the MCC market and we believe that while most of the vendors offer similar products, the ease of integration to different EMRs differ. Some offer a more complete set of features and cater to both the needs of the physician network in addition to billing specialists but some focus solely on the physician community. Security is a prerequisite for operating in this market and 2 factor authentication and higher requirements for security dominate this mobile application market. The products also don’t offer the same level of customizability. Automated validation of charges is a feature that varies by product and some vendors offer a more holistic set of AQA functionality. In order to protect our sources and vendors who have shared information with us, we choose not to reveal vendor names here. The above graph shows 3 sample vendors but we have chosen not to include all the vendors in this study. Contact us for any information pertinent to this growing and nascent healthcare market!
|
AuthorRL Narayan is a Digital Technology Evangelist and Entrepreneur with over 25 years in the technology industry. Archives
March 2019
Categories |








 RSS Feed